| Model | Serial No. | Date | Probe | Probe Serial | Probe Channel |
|---|---|---|---|---|---|
| LUM-310X | 123456789012 | 2020/06/11 09:19 | K-10A | U005310 | Factory Cal File(0) |
| XYZ coefficient | Probe Calibration file | Measurement Limit(nit) |
|---|---|---|
| X=1.0384, Y=1.0000, Z=1.0099 | LUM-310X_K-10A_U005310_20200605.probe | No information |
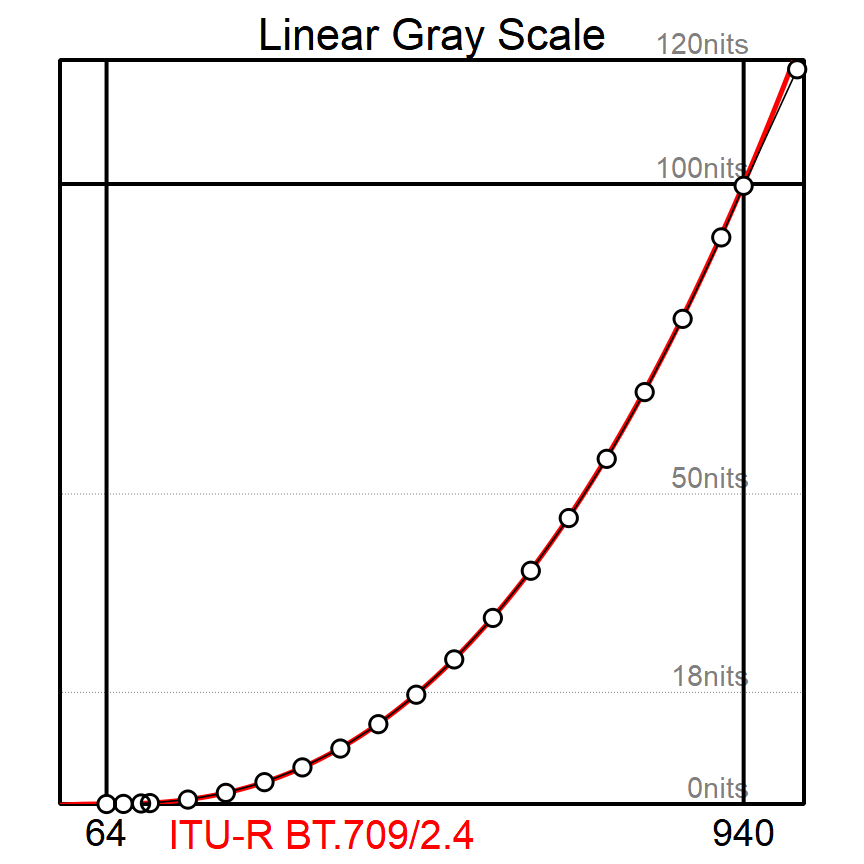
Linear graph helps to evaluate the accuracy of color reproduction in the highlight. Red solid line is target tone curve and white dots are the actual measurement result of the monitor.
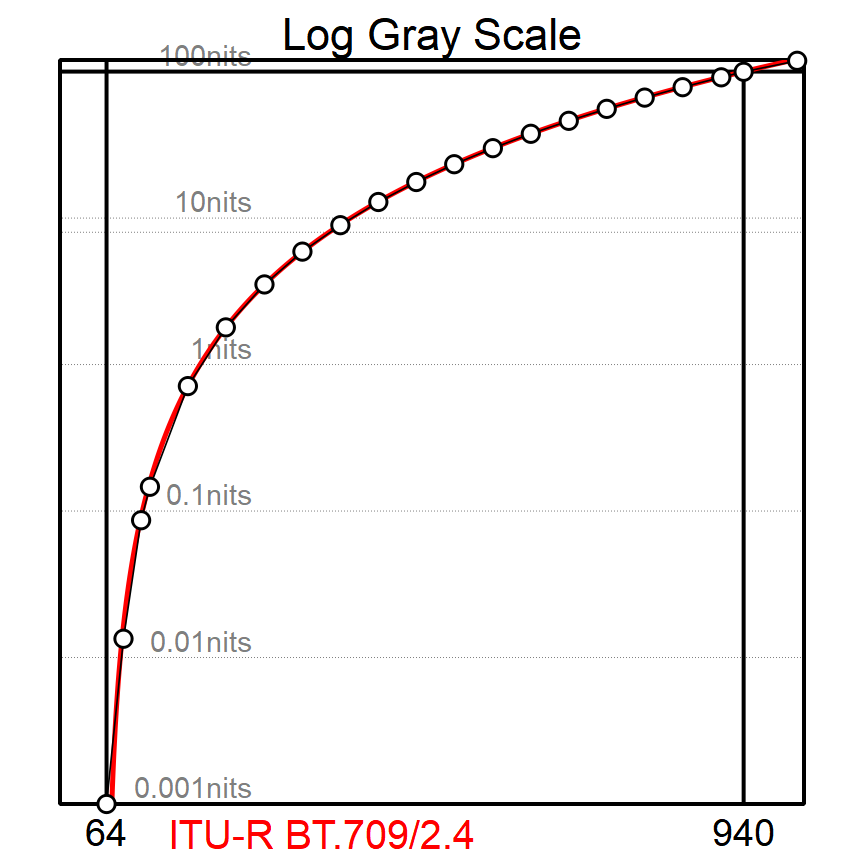
Log graph helps to evaluate the accuracy of color reproduction in the shadow (dark colors). Black level and in-frame dynamic range are decided by the specification of the display panel technology and backlight.
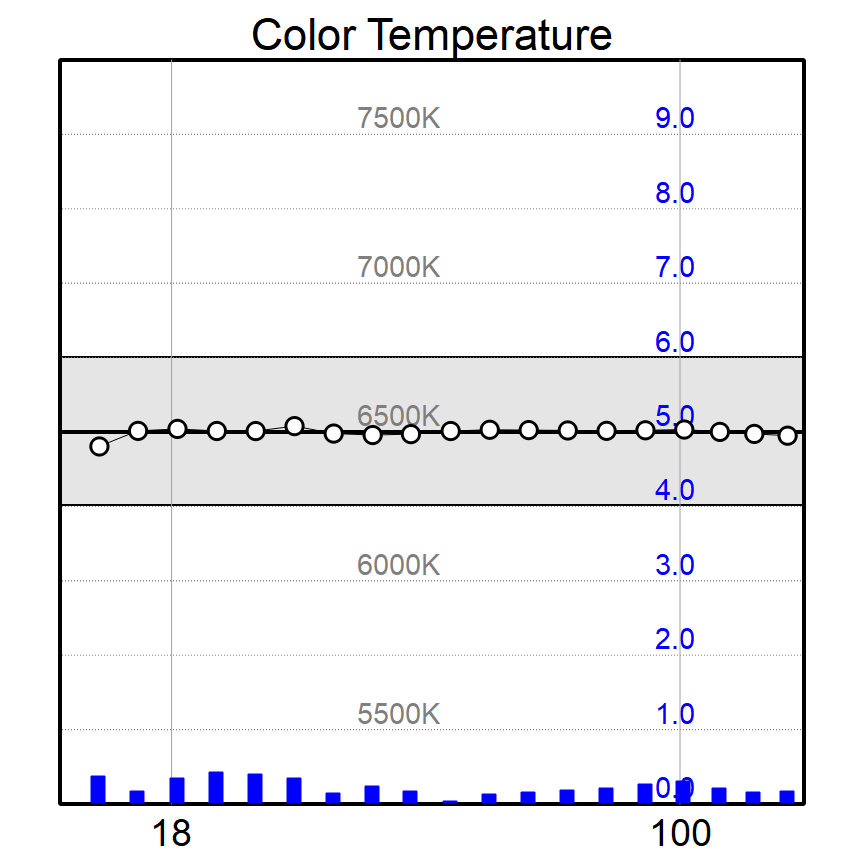
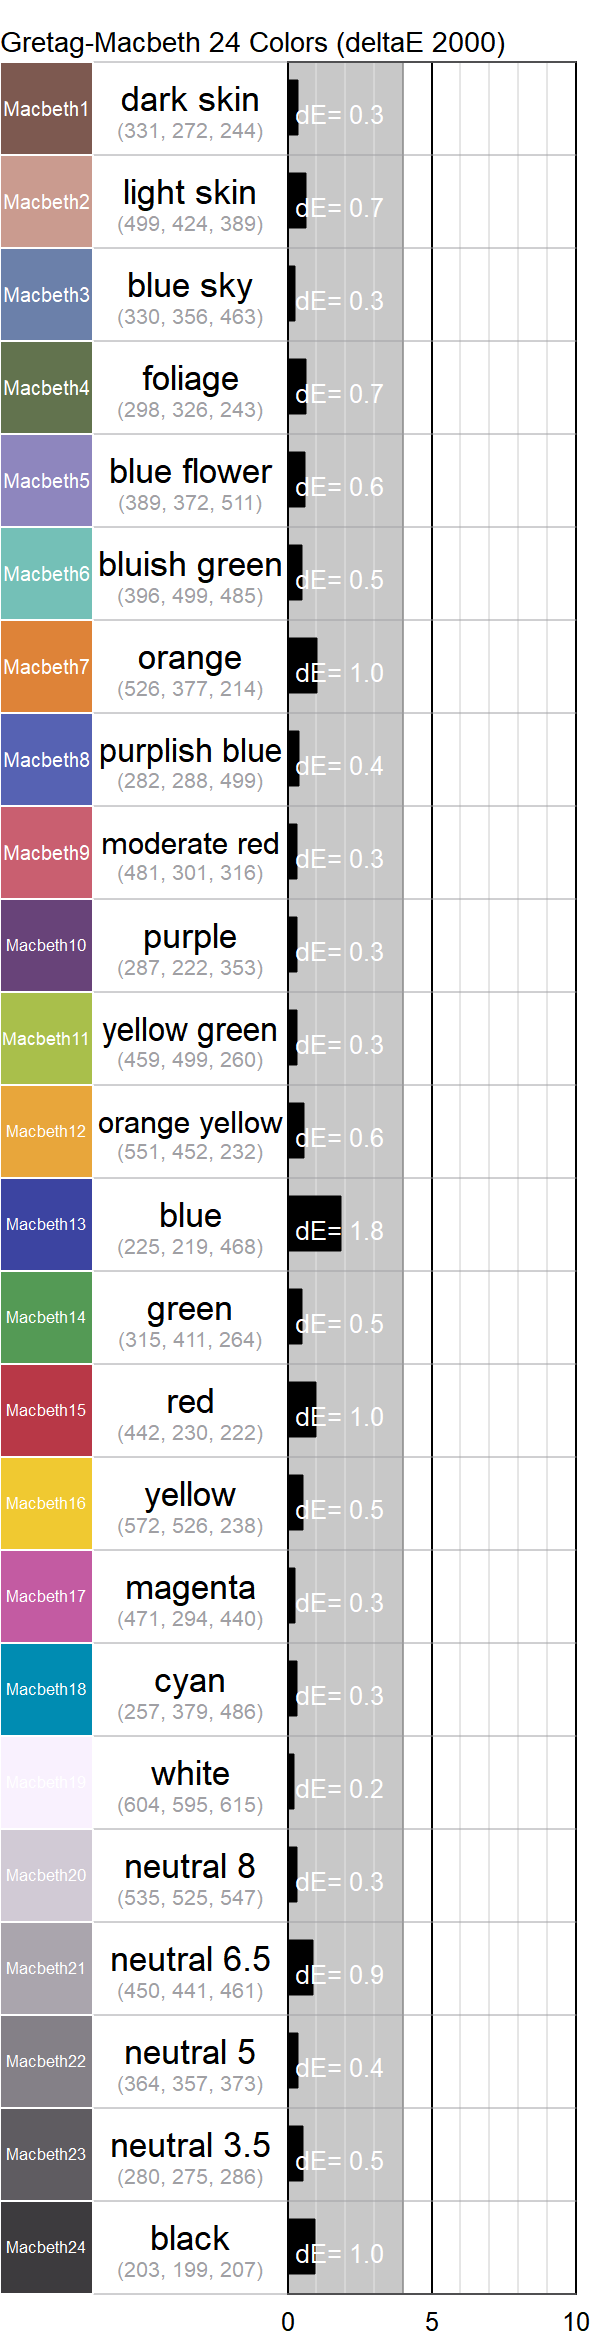
Target color temperature is D65 (Daylight 6500K) and the calibration tolerance is between 6250K and 6750K. Blue bars show the color difference (deltaE 2000) of actual measurement values from the target. Red bars and red numbers are also the color difference but the target is outside of the gamut. DeltaE values of Grade 1 monitors should be less than 1.0.
Gray Scale Result Table
| Measured | Color Temp. | deltaE | |
|---|---|---|---|
| Black | 0.0002nits | ||
| 18 nits | 17.9nits | 6512K | 0.3 |
| 30 nits | 29.9nits | 6498K | 0.4 |
| 40 nits | 40.0nits | 6510K | 0.2 |
| 50 nits | 49.9nits | 6490K | 0.2 |
| 60 nits | 59.9nits | 6498K | 0.1 |
| 70 nits | 69.9nits | 6507K | 0.1 |
| 80 nits | 79.8nits | 6506K | 0.2 |
| 90 nits | 89.7nits | 6504K | 0.2 |
| 100 nits | 99.7nits | 6510K | 0.3 |
| Maximum | 118.5nits | 6486K | 0.2 |
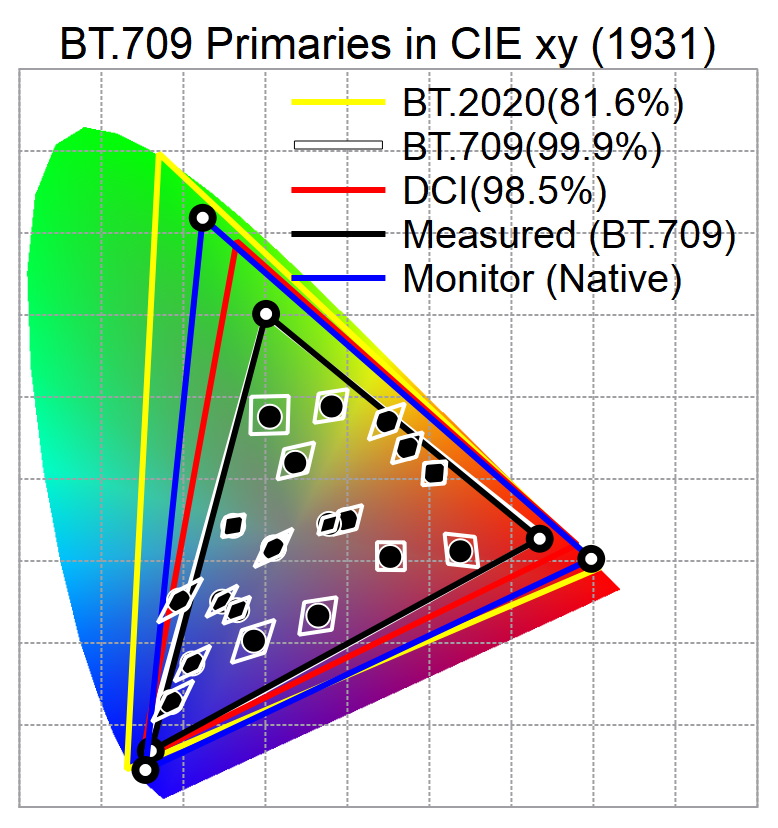
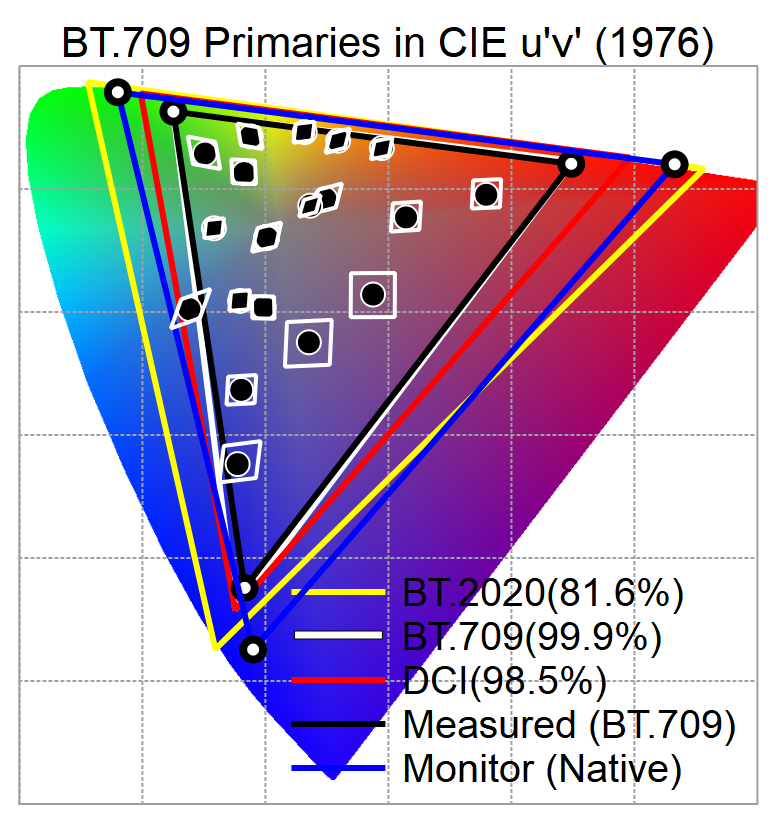
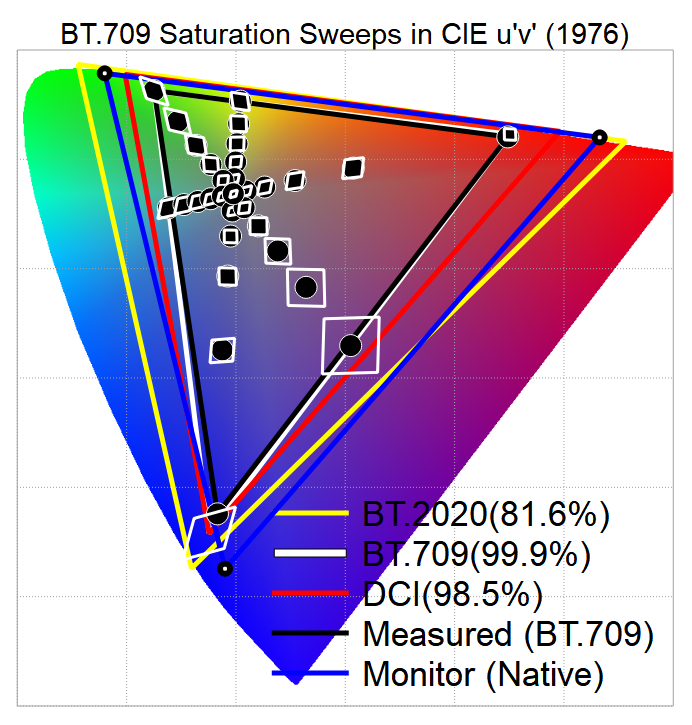
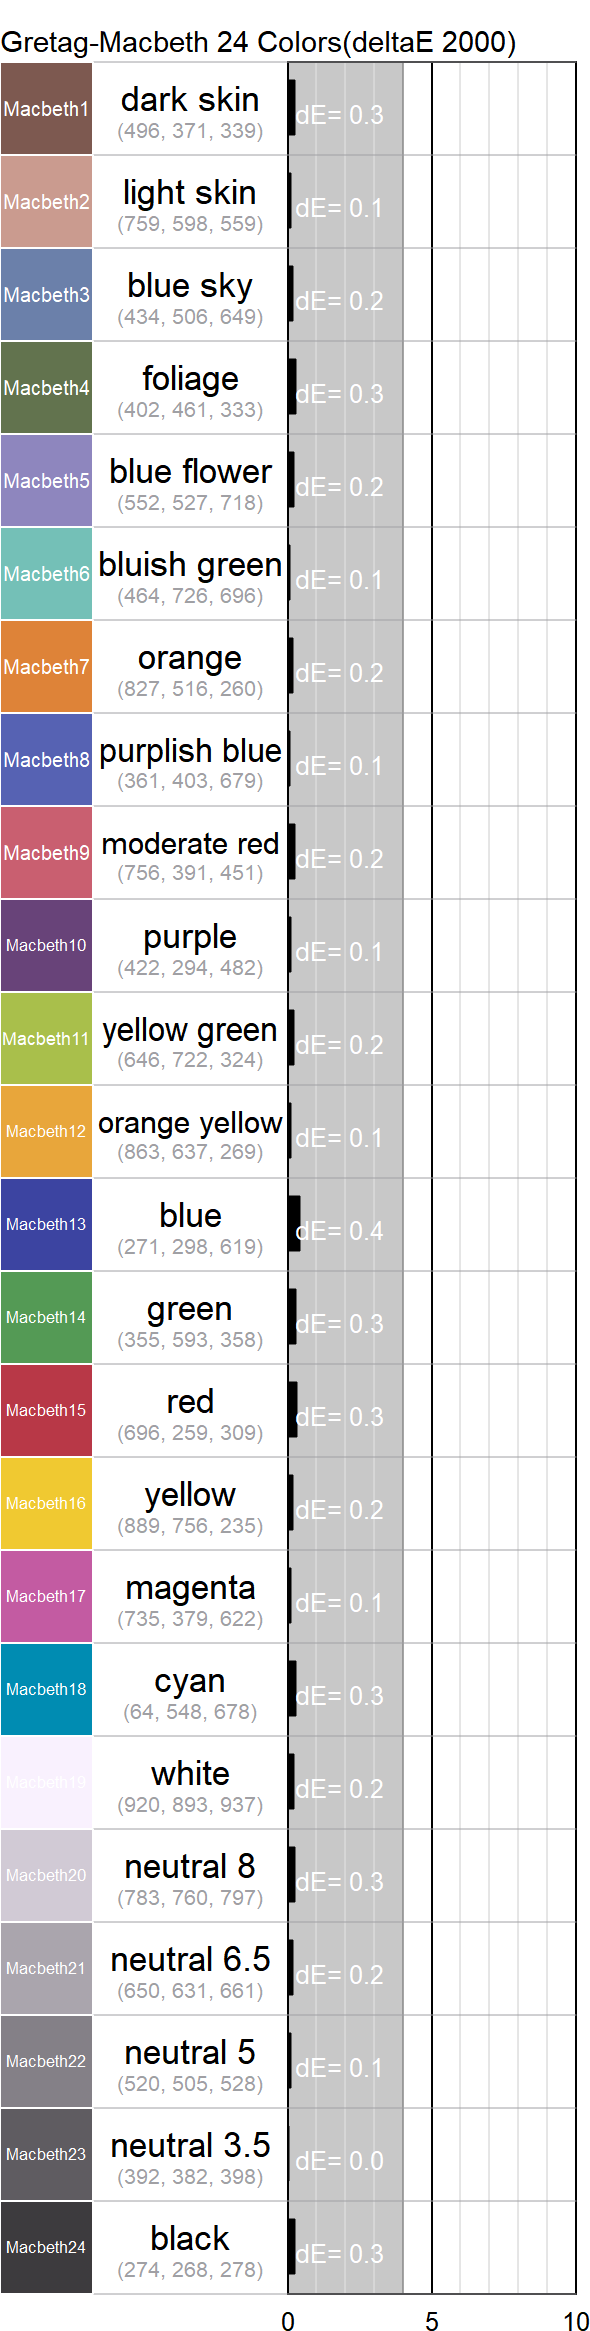
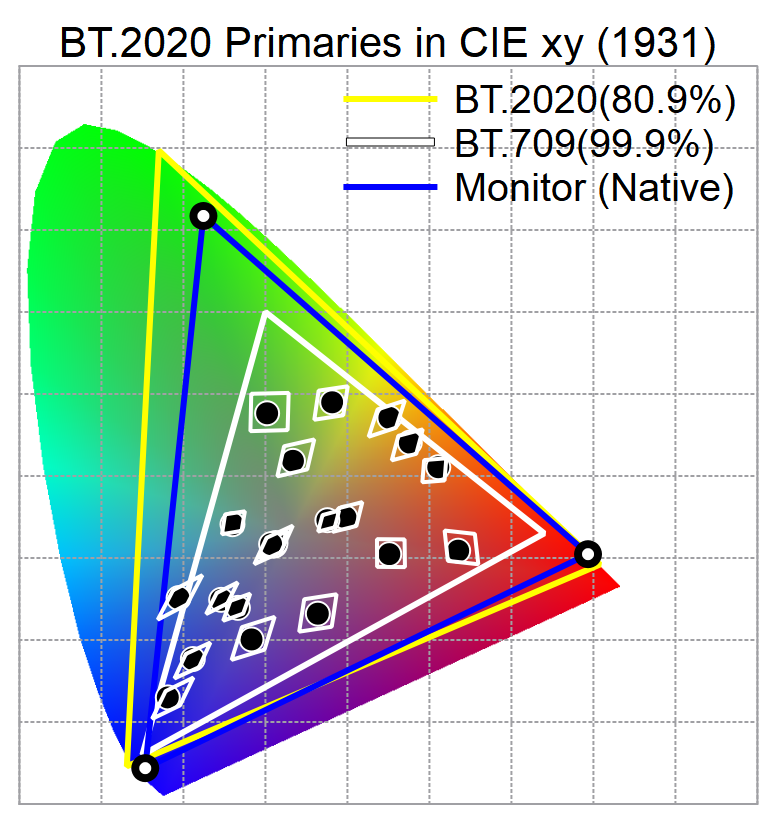
Black dots are measured values of 24 colors from Gretag-Macbeth color chart after calibration. Tetragonals show the areas within deltaE 4.0. Percentage number in legends are gamut covering ratios calculated by actual measurements.
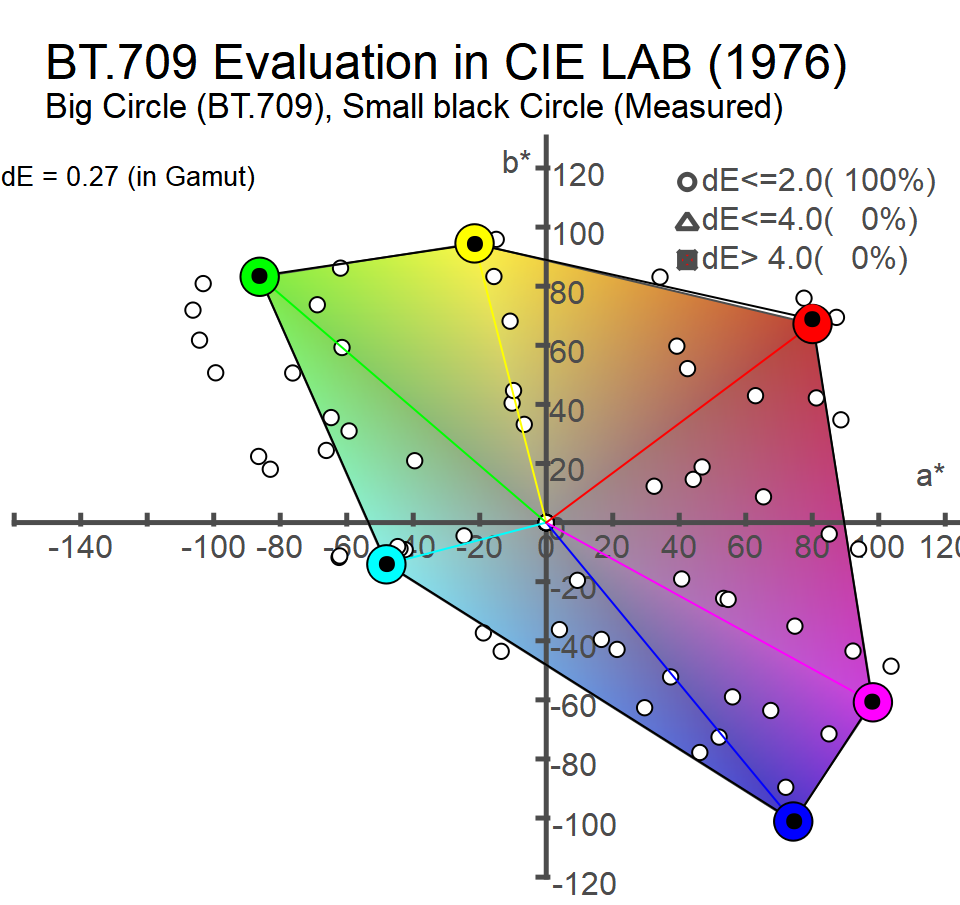
Colored area with big circles of RGB & CMY is the target (BT.709). Small black circles with hexagonal lines are measured. Small white dots are measured colors with less than deltaE 2.0 errors.
Calibration Error Histgram for 146 colors
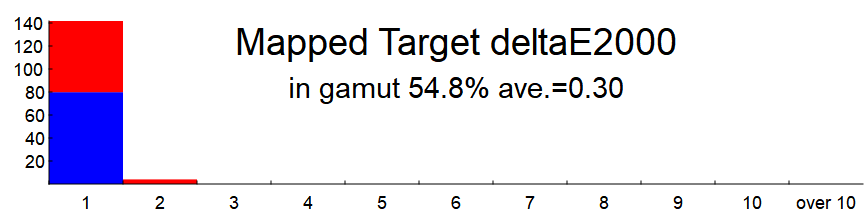
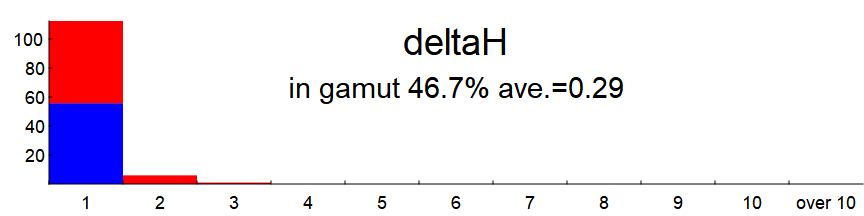
Upper is deltaE2000, lower is dH(hue angle error) distribution. Blue bar is in gamut colors, red bar is for color outside of the gamut, calculated the error with mapped target.
This graph helps to evaluate if the primary and sub-primary colors are accurately reproduced.
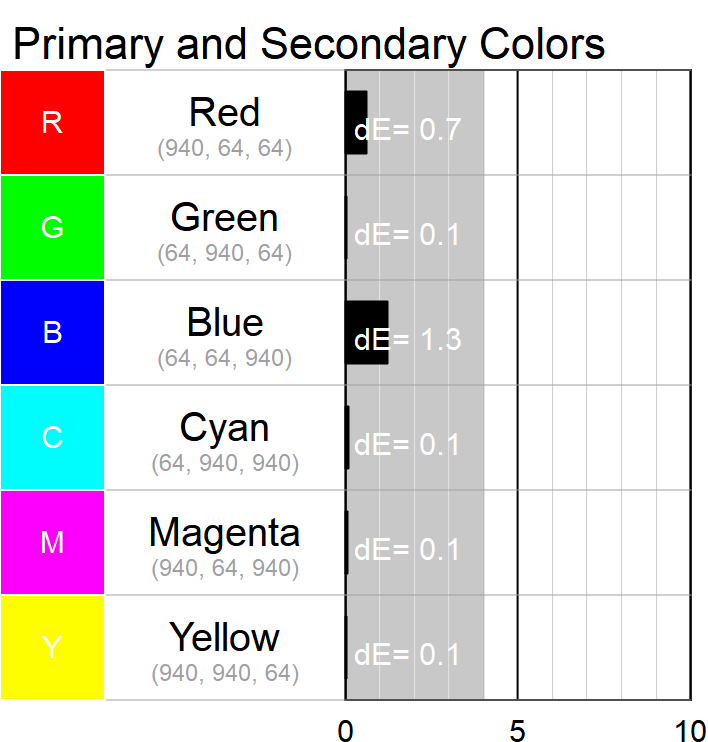
Color difference (deltaE 2000) of Primary and Secondary colors of BT.709 / 2.4.
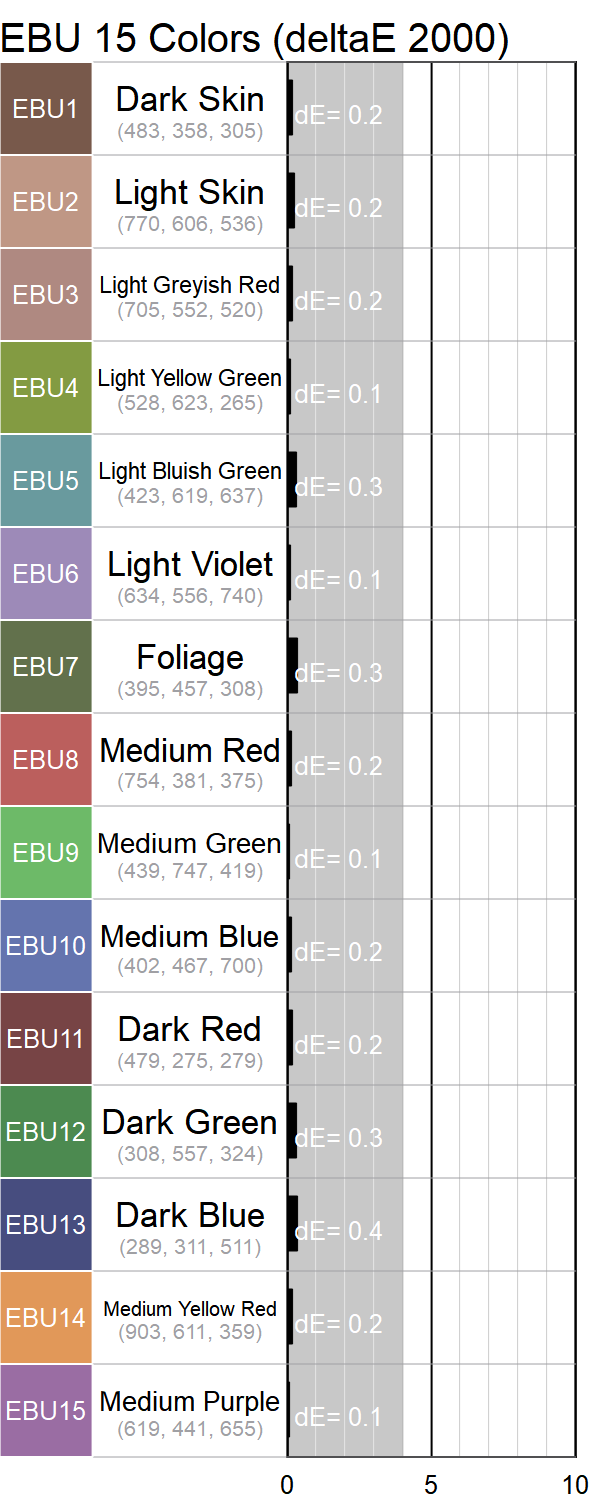
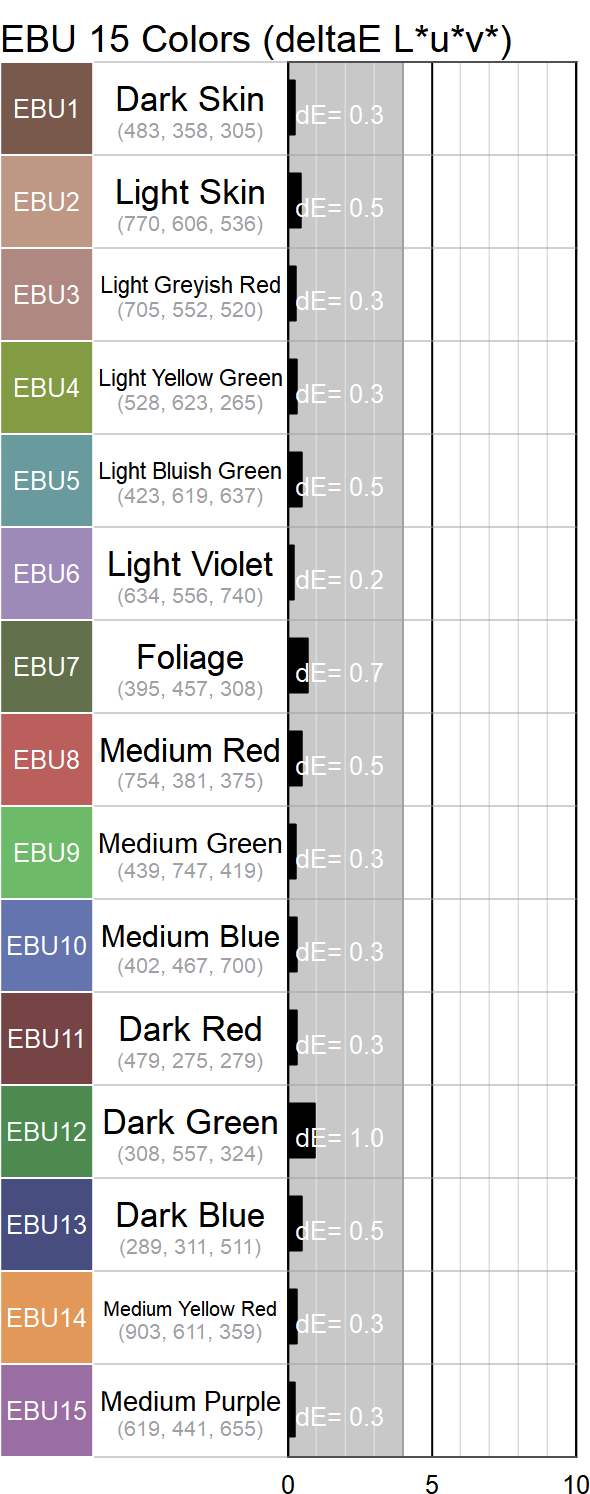
EBU 15 colors are from EBU-Tech. 3325 (Sep. 2008) Table 8.
TVLogic LUM-310X Calibration Report (HDR)
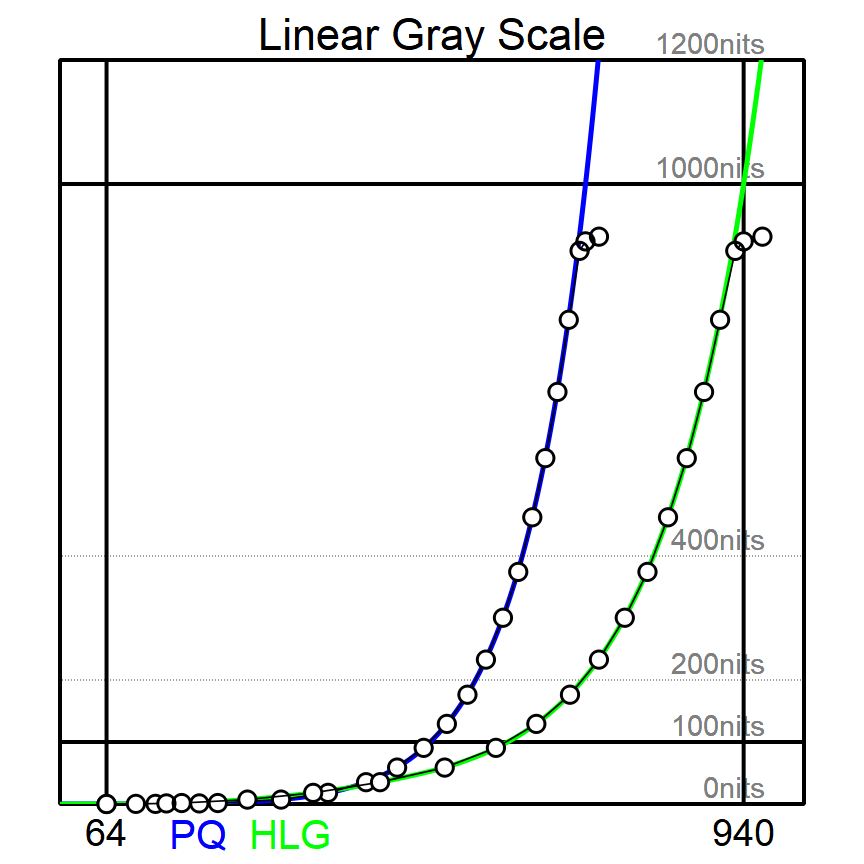
Linear graph helps to evaluate the accuracy of color reproduction in the highlight. Red solid line is target tone curve and white dots are the actual measurement result of the monitor.
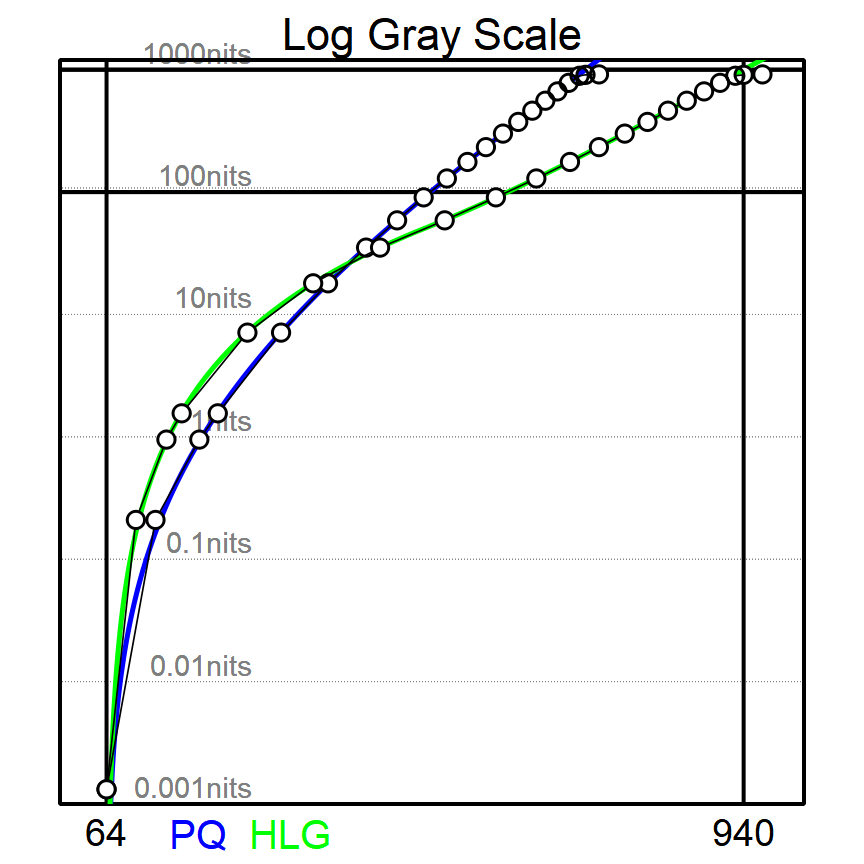
Log graph helps to evaluate the accuracy of color reproduction in the shadow (dark colors). Black level and in-frame dynamic range are decided by the specification of the display panel technology and backlight.
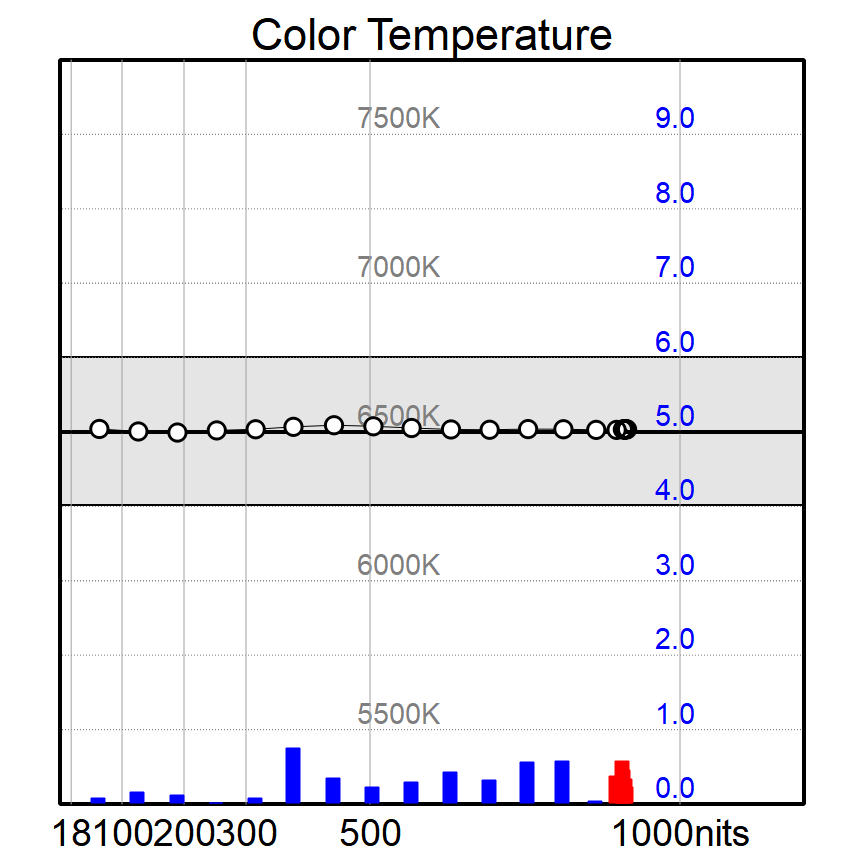
Target color temperature is D65 (Daylight 6500K) and the calibration tolerance is between 6250K and 6750K. Blue bars show the color difference (deltaE 2000) of actual measurement values from the target. Red bars and red numbers are also the color difference but the target is outside of the gamut. DeltaE values of Grade 1 monitors should be less than 1.0.
Gray Scale Result Table(HDR)
| Measured | Color Temp. | deltaE | |
|---|---|---|---|
| Black | 0.0013nits | ||
| 100 nits | 101.0nits | 6502K | 0.2 |
| 200 nits | 200.3nits | 6500K | 0.1 |
| 300 nits | 299.5nits | 6507K | 0.3 |
| 400 nits | 399.0nits | 6519K | 0.4 |
| 500 nits | 500.3nits | 6520K | 0.3 |
| 600 nits | 599.4nits | 6511K | 0.1 |
| 700 nits | 698.3nits | 6508K | 0.2 |
| 800 nits | 793.8nits | 6510K | 0.8 |
| 900 nits | 877.8nits | 6507K | 0.1 |
| 1000 nits | 907.5nits | 6509K | 0.6 |
| Maximum | 915.0nits | 6509K | 0.2 |
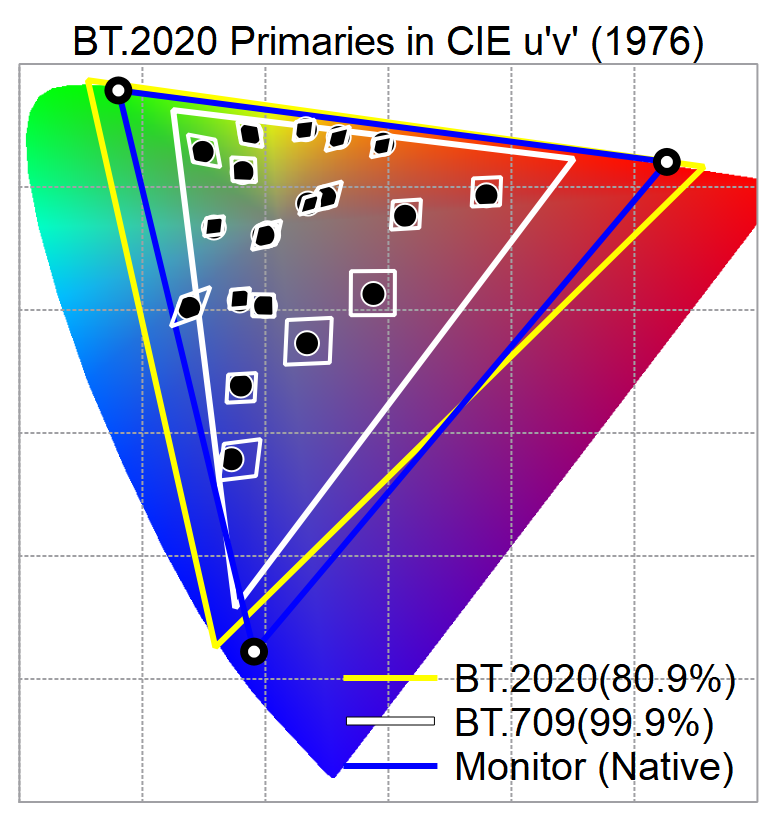
Black dots are measured values of 24 colors from Gretag-Macbeth color chart after calibration. Tetragonals show the areas within deltaE 4.0. Blue triangle is the gamut of this monitor. All BT.2020 colors will be decently mapped inside of this gamut by the calibration.
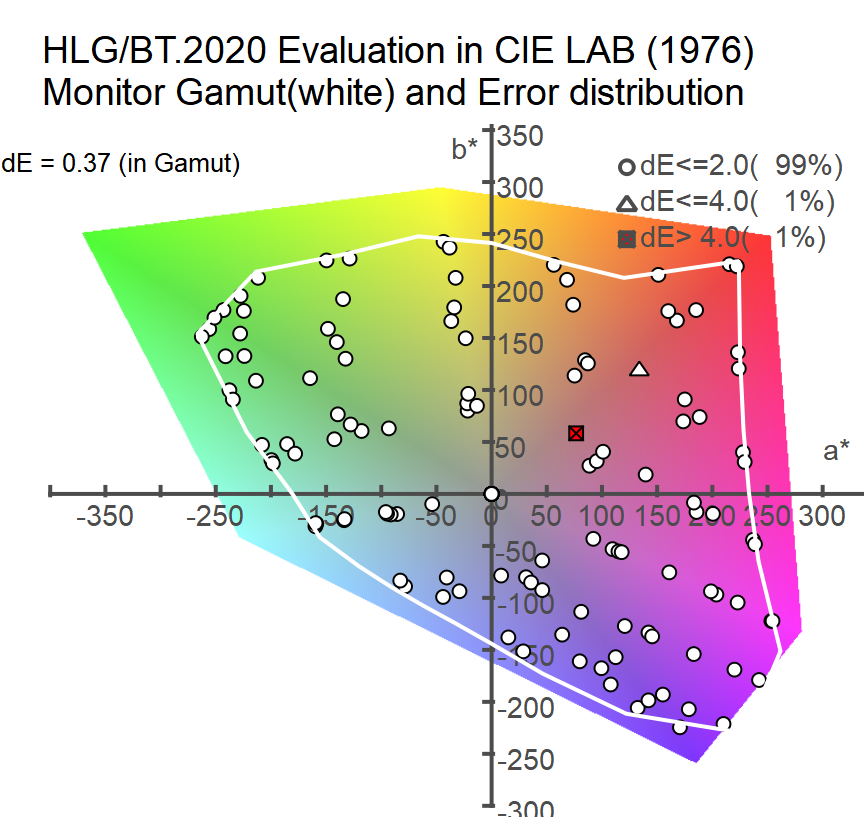
Colored area is the BT.2020 color gamut. White solid line shows the boundary of the monitor’s color gamut. Small white dots are measured colors with less than deltaE 2.0 errors.
Calibration Error Histgram for 146 colors
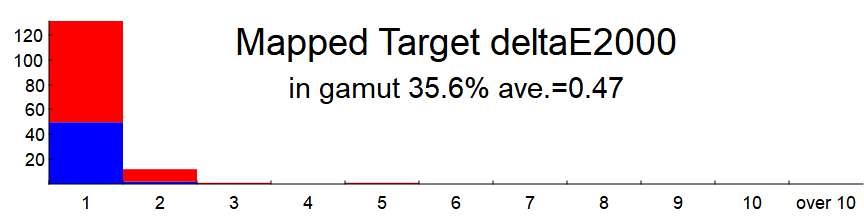
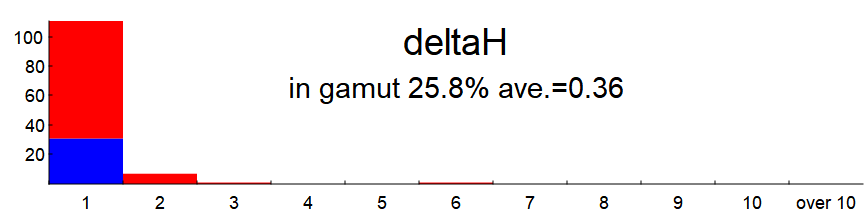
Upper is deltaE2000, lower is dH(hue angle error) distribution. Blue bar is in gamut colors, red bar is for color outside of the gamut, calculated the error with mapped target.
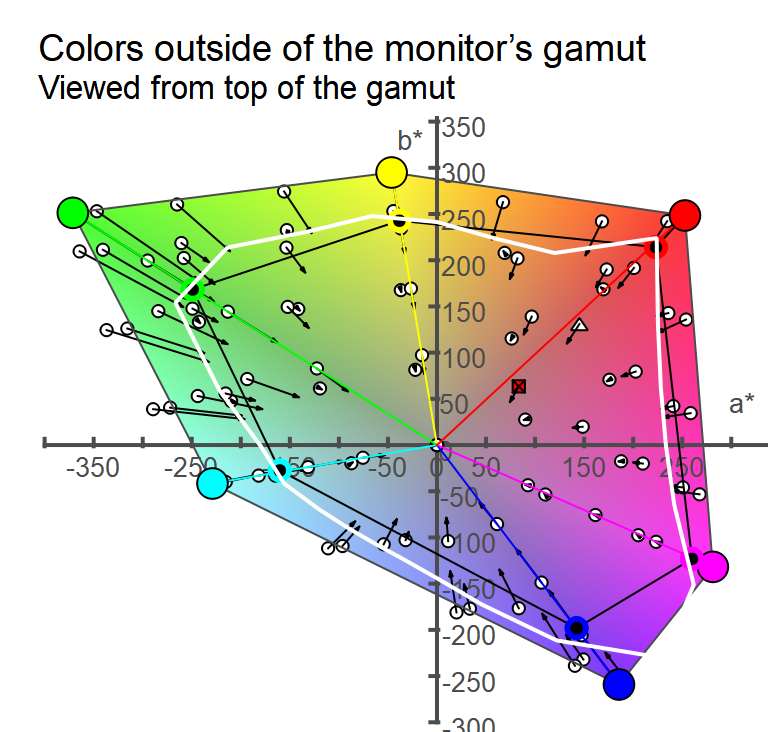
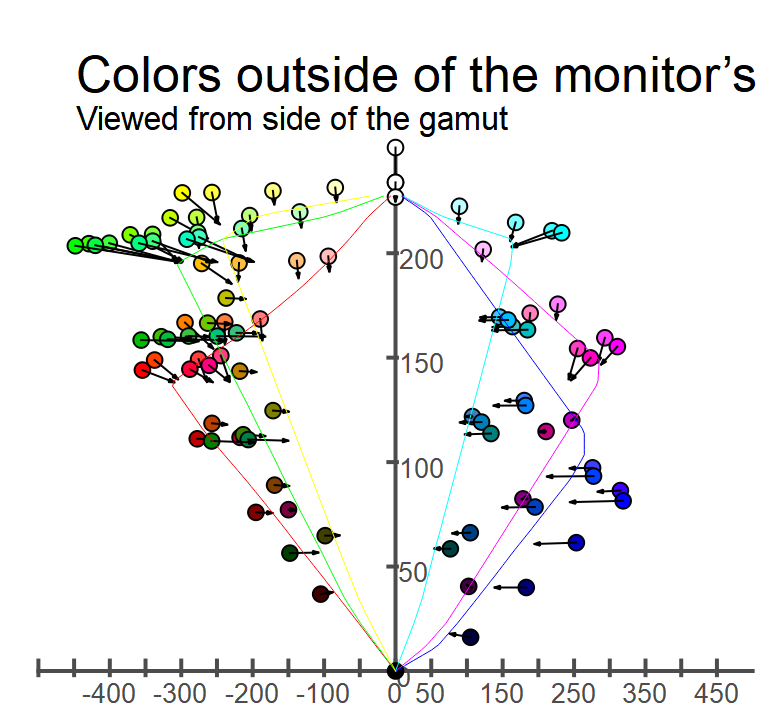
The two graphs above shows how the colors outside of the monitor’s color gamut are mapped onto the monitor’s gamut surface. For these colors outside the monitor’s color gamut, the brightness and/or saturation are reduced while preserving the same color hue.
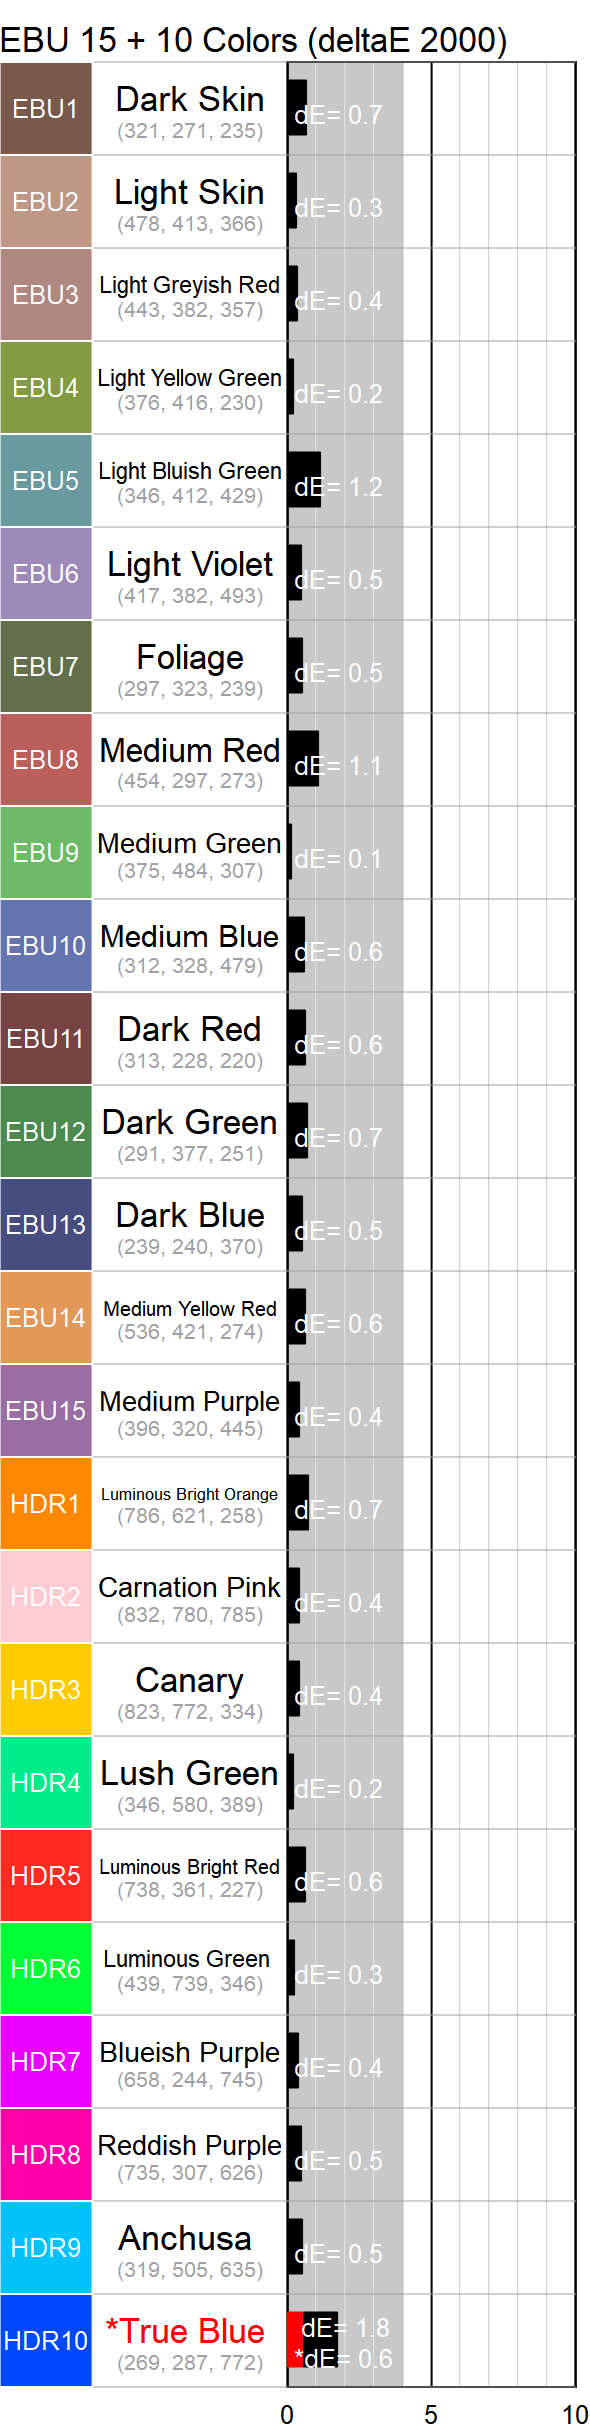
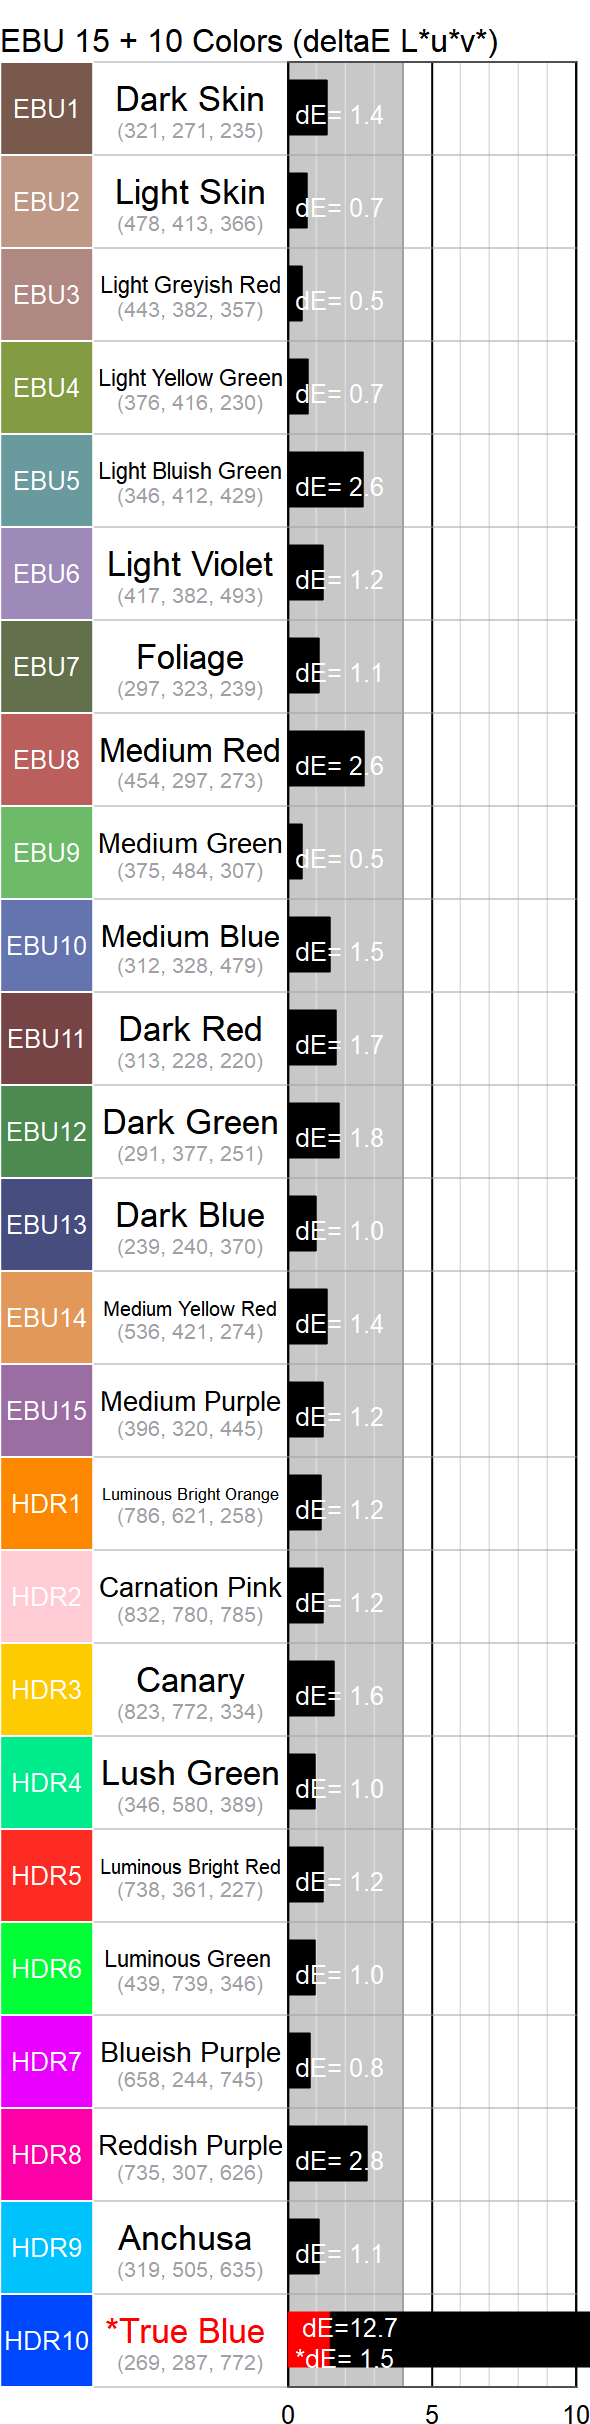
EBU 15 colors are from EBU-Tech. 3325 (Sep. 2008) and EBU 10 HDR colors are from EBU-Tech.3325 s1 (Sep. 2019).
The name of the colors in red are test colors which are outside of the monitor’s gamut. These test colors are mapped onto the monitor’s gamut surface, and the deltaE between the mapped target color and actual measurement is shown as *dE and red bar.